The Asset CyfroTopology Diagram gives you a unified network view of discovered assets and their correlated security context.
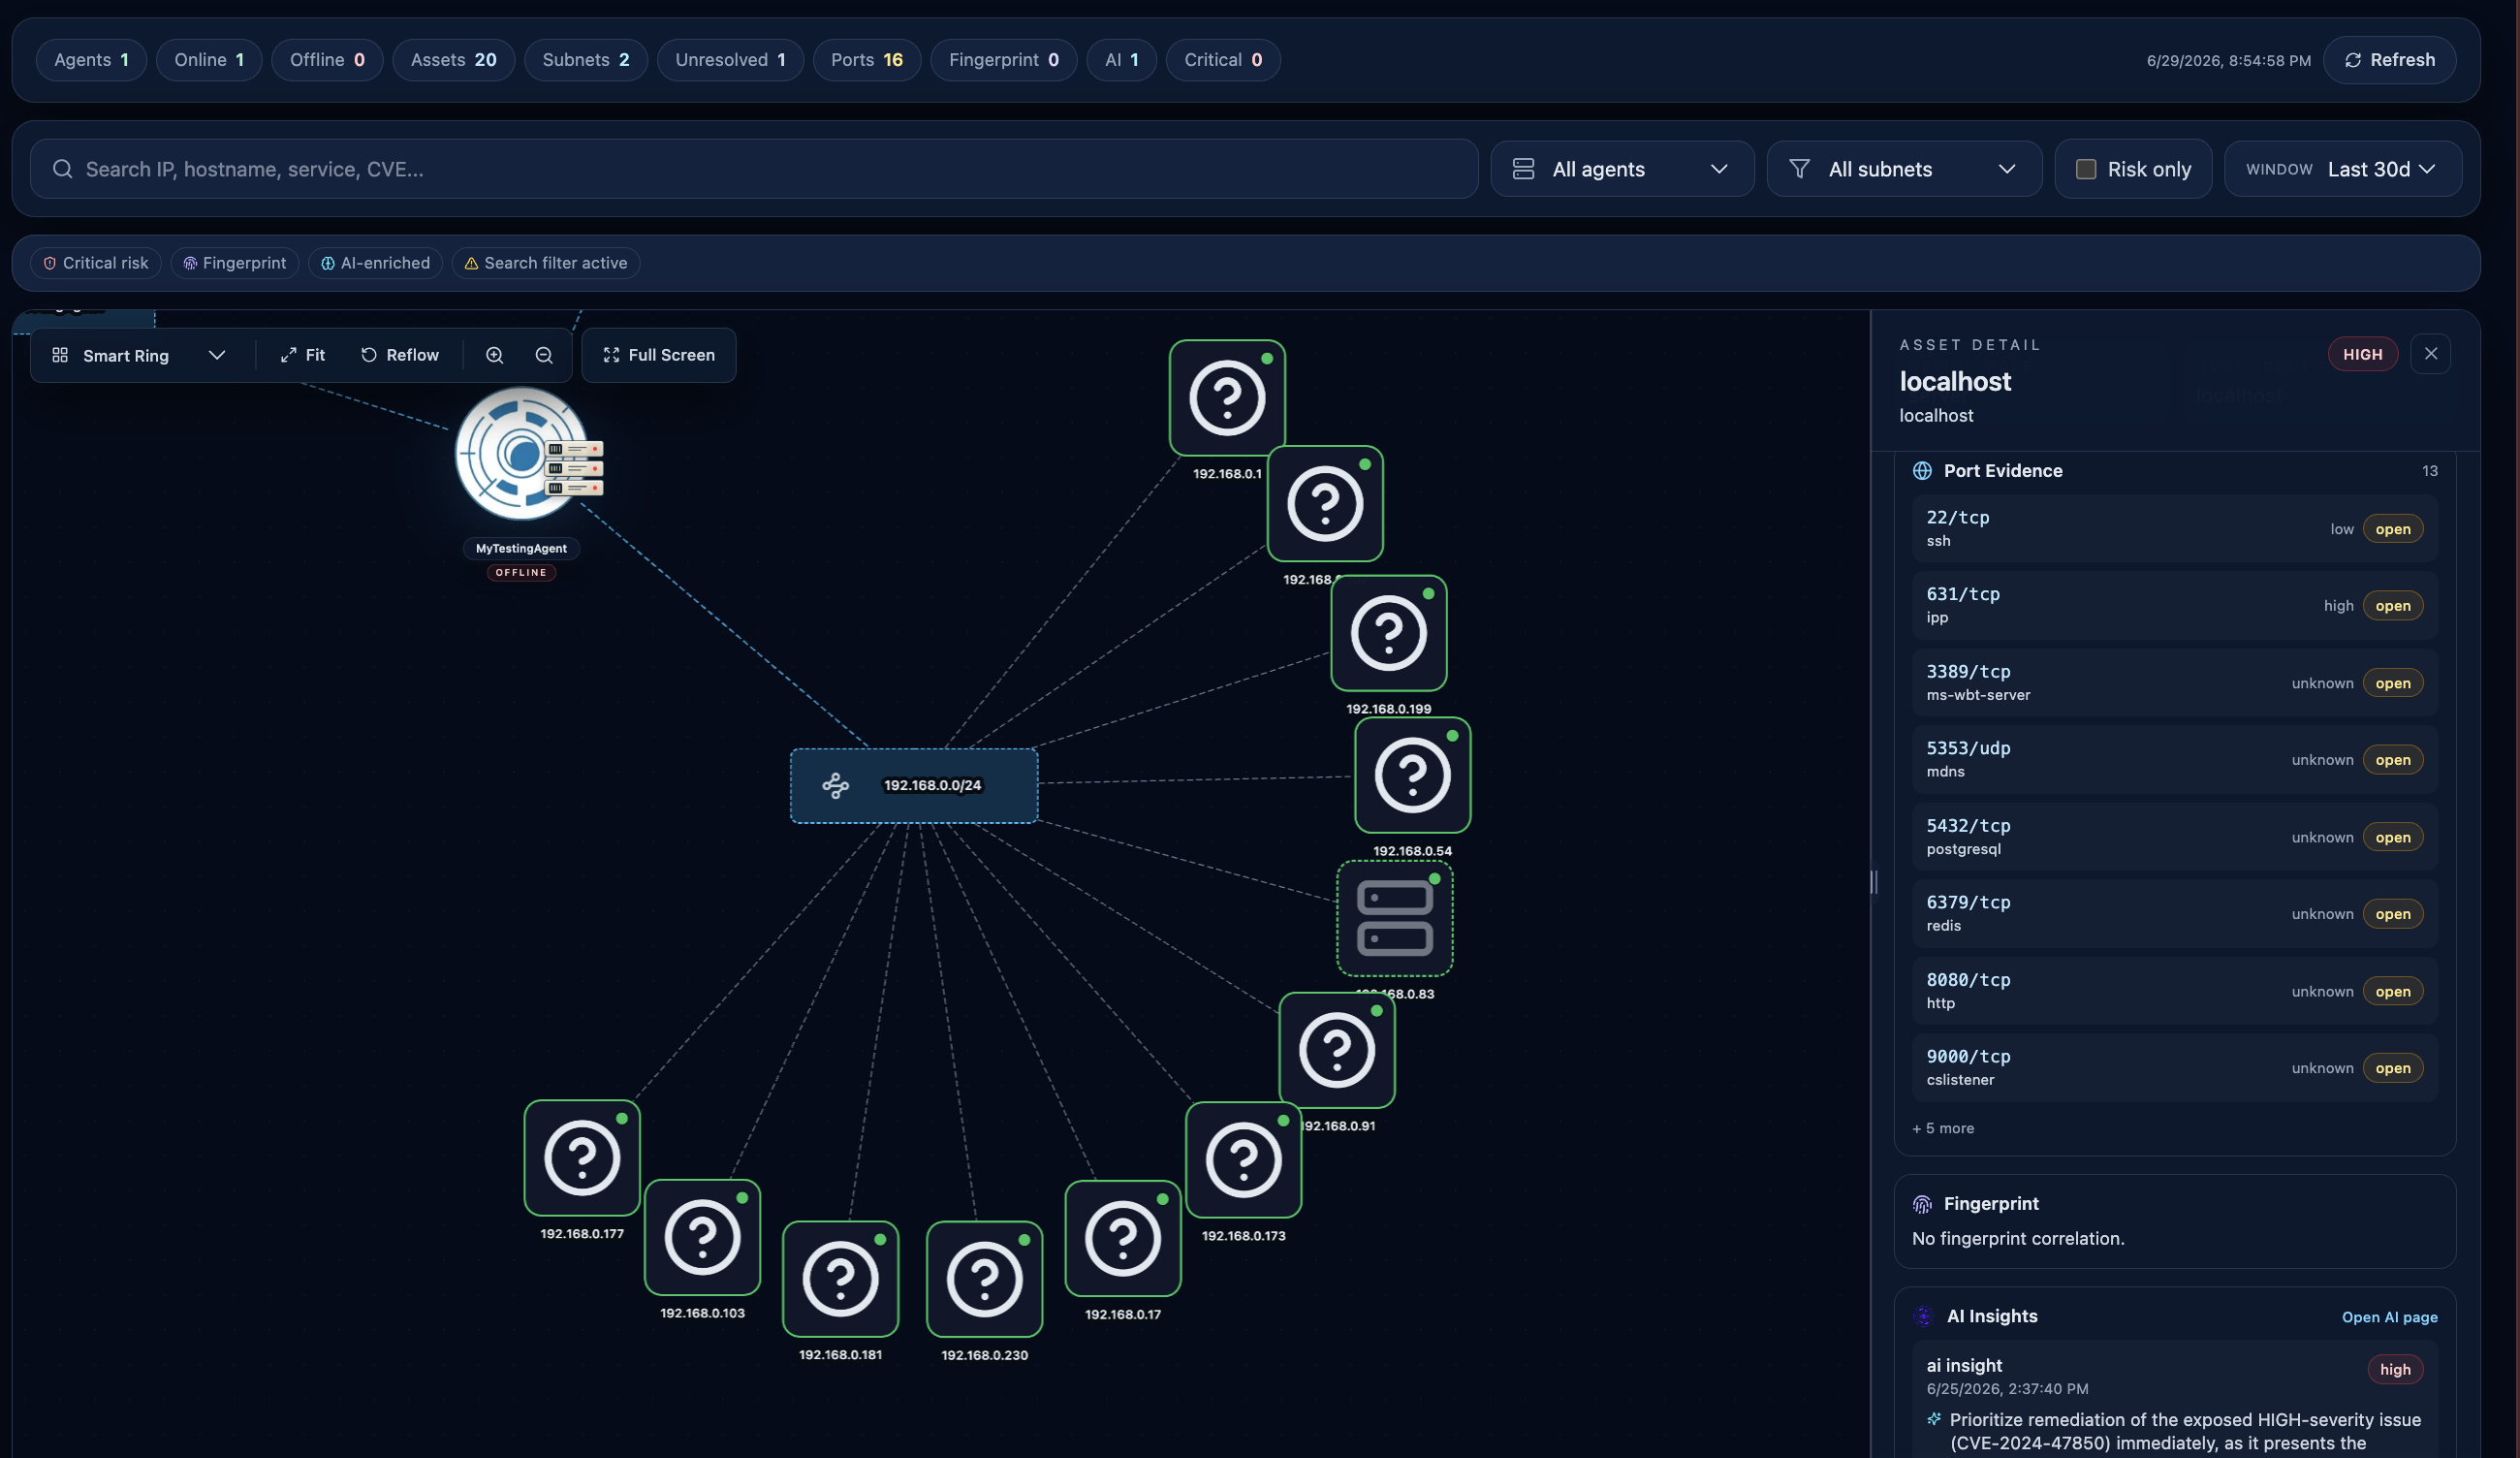 The topology workspace: an interactive graph with per-asset port evidence, fingerprint, and AI insight drawer.
It combines:
- Discovered topology relationships
- Open-port evidence
- Fingerprint summaries
- CyfroAI insight highlights
- Ranked risk context
Accessing the CyfroTopology View
The page loads topology data for the currently selected account group.
If no topology data exists yet, the page shows an empty state with guidance to run discovery/scanning first.
Desktop Experience
On desktop, topology renders as an interactive workspace with:
- Toolbar and filters
- Interactive graph canvas
- Integrated asset detail drawer
Toolbar Summary Chips
The top summary row shows current snapshot counts:
- Assets
- Subnets
- Ports
- Fingerprint
- CyfroAI Insights
- Critical
It also shows the snapshot generation timestamp and a Refresh action.
Filters
The filter toolbar supports:
- Search (IP, hostname, service, CVE, vendor, AI text)
- Subnet selector
- Risk only toggle
- Time window selector (7d, 14d, 30d, 90d)
Graph Controls
The canvas includes:
- Fit (fit graph to viewport)
- Reflow (re-run layout)
- Zoom controls
- Fullscreen toggle
Asset Detail Panel
Selecting an asset opens a detail panel with structured sections:
- Asset metadata
- Port Evidence
- Fingerprint Summary
- AI Insights
- Top Risks
- Correlation Notes
Port Evidence
Shows correlated service observations such as:
- Port/protocol
- Service or product hints
- State and severity context
Fingerprint Summary
Shows fingerprint correlation details including:
- Target identity
- Highest severity
- Vulnerability count
- Misconfiguration/secret counts
AI Insights
Shows asset-linked AI summaries with:
- Source type
- Timestamp
- Highest risk badge
- Short summary lines
The panel includes a direct link to the full AI page for deeper review.
Top Risks
Lists prioritized risks with:
- Title
- Vulnerability/package/target context
- Effective risk level
- AI-provided reasoning
Correlation Behavior
CyfroSec uses conservative correlation rules. Evidence is attached to an asset only when identity mapping is reliable.
If a finding cannot be safely matched, it is kept separate from direct asset attribution to avoid false linkage.
Examples that commonly require additional context:
- Generic or filesystem fingerprint targets
- Scan artifacts without host identity metadata
- Ambiguous multi-host correlation paths