
The Dashboard is your central view of the security health of your infrastructure. It brings together scan status, vulnerability findings, agent health, asset discovery, GDPR compliance, and AI-generated insights into a single customisable page that updates when you switch between account groups.
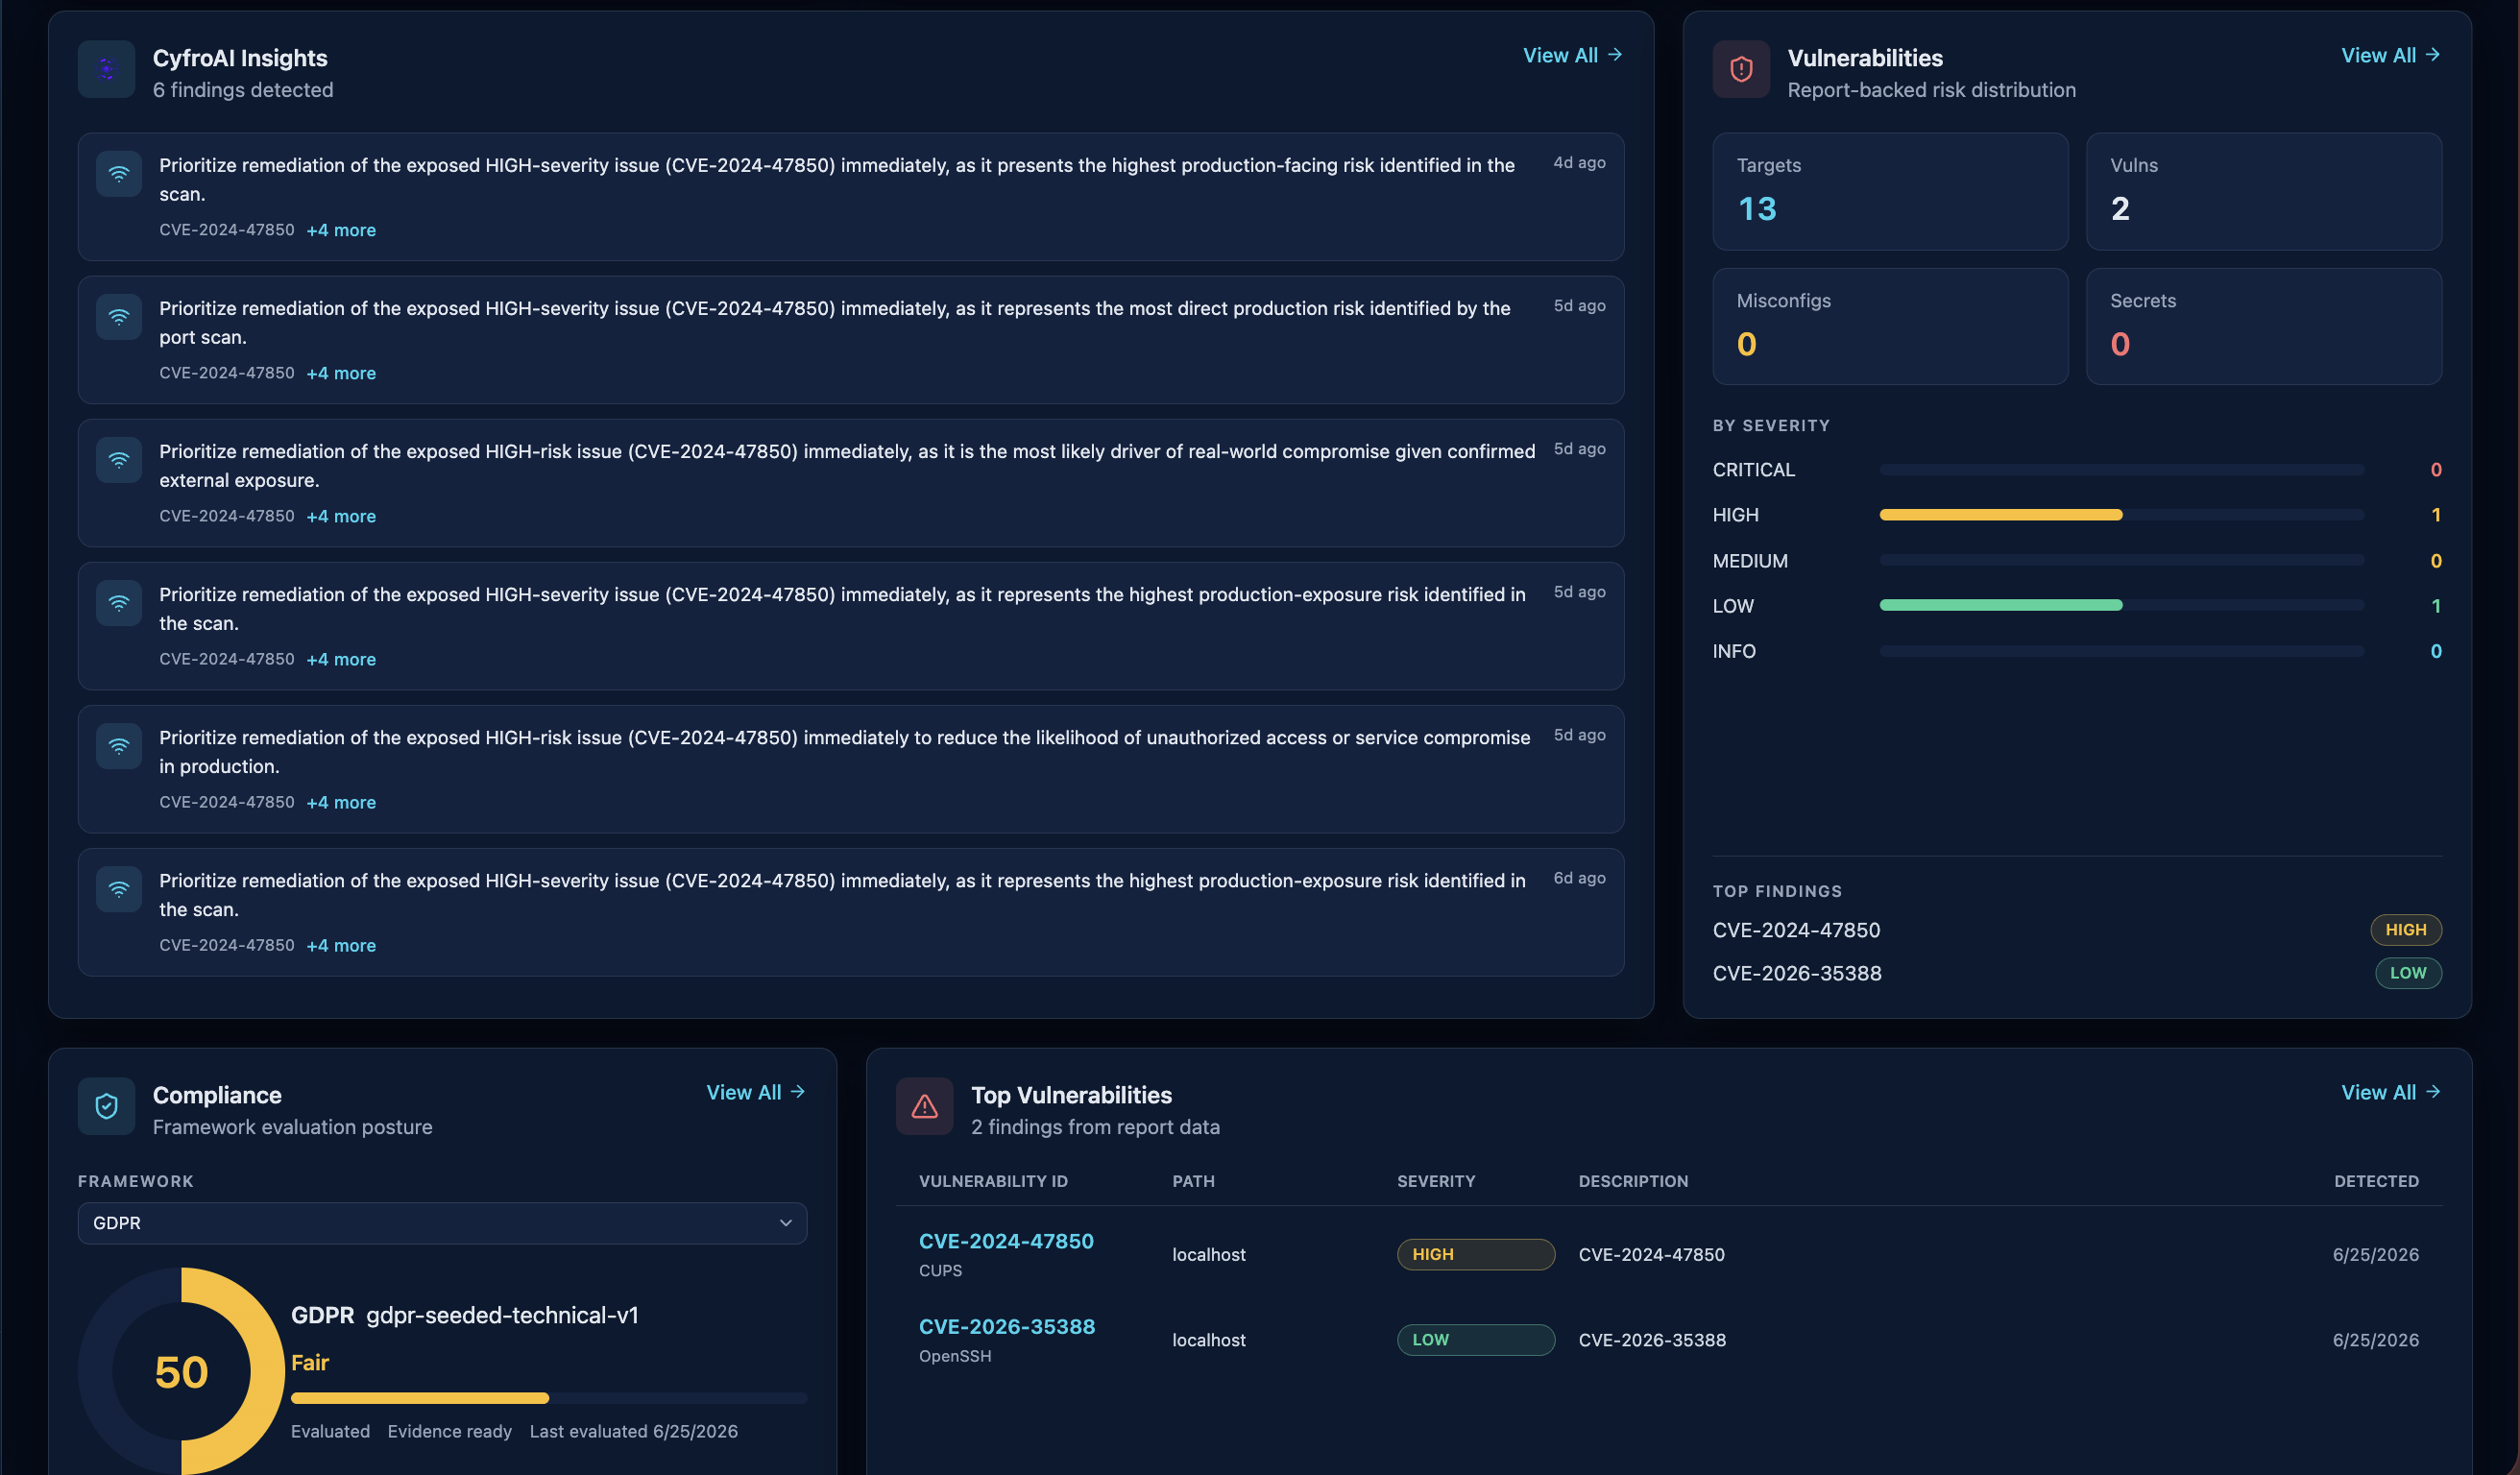 The Dashboard brings scan status, findings, agent health, compliance, and CyfroAI Insights into a single view.
The Stats Row
A pinned row at the top of the Dashboard always shows three high-level metrics for the current account group:
| Metric | Description |
|---|---|
| Completed Scans | Number of scans currently in a completed state |
| Active Scans | Number of scans currently running or pending execution |
| Failed Scans | Number of scans currently in a failed state |
These are point-in-time counts, not cumulative historical totals.
Dashboard Widgets
Below the stats row, seven widgets are arranged in a grid. Each widget independently fetches its own data for the current account group.
Default Widget Layout
The default layout is a 12-column grid with one pinned full-width row, followed by resizable cards:
| Row | Default cards (left to right) |
|---|---|
| Pinned top row | Dashboard Stats (full width) |
| Row 1 | CyfroAI Insights (large), Vulnerability Summary (small) |
| Row 2 | GDPR CyfroCompliance (small), Top Vulnerabilities (large) |
| Row 3 | Scan Status (small), Agent Status (small), Asset Discovery (small) |
Small cards use one-third width, large cards use two-thirds width, and the pinned stats row is always full width.
CyfroAI Insights
- Shows up to 4 recent AI-generated insight summaries.
- Each card includes source type, relative timestamp, and a plain-text preview.
- A +N more indicator appears when more findings exist than fit in the preview.
- View All opens the full CyfroAI Insights page.
- Empty state: "No AI insights yet — Run scans to generate AI analysis."
Vulnerability Summary
- Quick stats for targets scanned, total vulnerabilities, misconfigurations, and secrets.
- Severity distribution across Critical, High, Medium, Low, and Info.
- Up to 6 top findings with severity badge, identifier, and occurrence count.
- Header timestamp shows the scan the data came from.
- Empty state: "No vulnerabilities found."
Top Vulnerabilities
- Shows up to 8 prioritised findings ordered by severity.
- Each row includes vulnerability ID, package, target, severity, description, and first-detected date.
- Clicking a row opens the matching report entry.
- View All opens the vulnerability report view.
- Empty state: "No high or medium vulnerabilities found."
GDPR CyfroCompliance
- Shows an overall score with colour-coded thresholding.
- Includes trend direction since the previous report when available.
- Displays critical, high, and total findings counts.
- Shows category breakdown with counts, proportional fill, and score.
- Refresh triggers a new compliance report without leaving the dashboard.
- Pending state appears if no report exists yet.
Scan Status
- Summary counts for Running, Done, Failed, and Pending scans.
- Normalised status labels such as Completed, Running, Pending, and Failed.
- Each listed scan shows status, category, assigned agents, and last run time.
- View All Scans opens the Scans Setup page.
- Empty state: "No active scans — Start a new scan to see status."
Agent Status
- Health summary for Healthy, Warning, and Offline agents.
- Each row shows agent name, location, status, last heartbeat, and scan counts.
- View All Agents opens the CyfroAgent management page.
- Empty state: "No agents found — No agents registered for this group."
Asset Discovery
- Quick stats for total assets, subnets, open ports, and IPv6 hosts.
- Recently discovered hosts with hostname, IP, and discovery time.
- Most common open ports with host counts and common service labels.
- Management protocols and storage services are shown as badges.
- View Asset Discovery opens the related report view.
Customising the Layout
The dashboard layout is fully customisable. Your arrangement is saved per browser and persists across sessions.
Entering Customise Mode
Click Customize Layout in the top-right toolbar. A blue banner confirms you are in customise mode.
Moving Widgets
Drag any widget by its grip handle to reposition it. Widgets automatically pack upward to fill gaps.
Resizing Widgets
- The minus button shrinks a widget to a small size.
- The plus button expands a widget to a large size.
- The top stats row is always full width and cannot be moved or resized.
Saving, Resetting, and Cancelling
| Button | Behaviour |
|---|---|
| Save Layout | Saves the current arrangement to the browser and restores it next time. |
| Reset | Restores the factory default arrangement in the draft view without saving. |
| Cancel | Discards unsaved changes and exits customise mode. |
Layout is stored in local browser storage, so clearing browser data or switching browsers restores the factory default.
Switching Account Groups
Use the account group selector in the sidebar to switch groups. Widgets reload their data for the new group while the saved layout stays the same.
Refreshing Data
- Reload the page to refresh all widgets.
- Use the GDPR widget refresh action to regenerate compliance data without a full reload.
Widget Navigation Shortcuts
Each dashboard card provides direct navigation into deeper workflows:
| Widget | Action | Destination |
|---|---|---|
| CyfroAI Insights | View All | CyfroAI Insights page |
| Top Vulnerabilities | View All | Report page (vulnerabilities tab) |
| Scan Status | View All Scans | Scans Setup page |
| Agent Status | View All Agents | CyfroAgent page |
| Asset Discovery | View Asset Discovery | Report page (asset discovery tab) |
This lets teams start triage from the dashboard and continue directly into task-specific pages.
Frequently Asked Questions on Dashboards
Why are some widgets showing no data or empty states? Each widget needs the relevant scans or agents to have run at least once.
Can different users have different dashboard layouts? Yes. Each user's layout is stored independently in their own browser.
Why do the stats numbers differ from what I expected? Dashboard stats reflect current states, not historical cumulative totals.
Can I add or remove widgets entirely? The current experience supports repositioning and resizing, but not hiding widgets completely.